
Analytics and BI
Built-in business intelligence that drills down to the document.
Dashboards, KPIs and reports sit on the same records as the documents, and Analytics figures drill down to the documents behind them. No separate reporting tool, no export-and-rebuild.
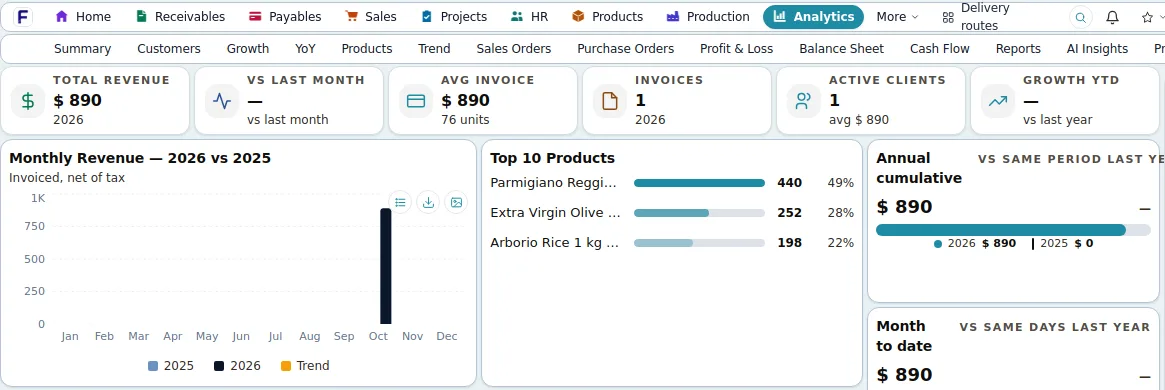
Screens shown are the product's own demo company, Harbor Foods. Figures are demo data.
Problems it solves
- Reports built by exporting to spreadsheets and rebuilding them every month
- Figures that cannot be traced back to the documents behind them
- Every role looking at the same dashboard
- Cash position known only after the close
Why it matters
What changes for your business.
Figures that drill down
Analytics views by customer, product, vendor and trend open the documents behind every number.
A home per role
KPI tiles, lists and work queues each person's role may see, on a canvas they arrange themselves.
Reports over every record
A report builder with custom fields, filters, grouping and totals, including your custom objects.
Home
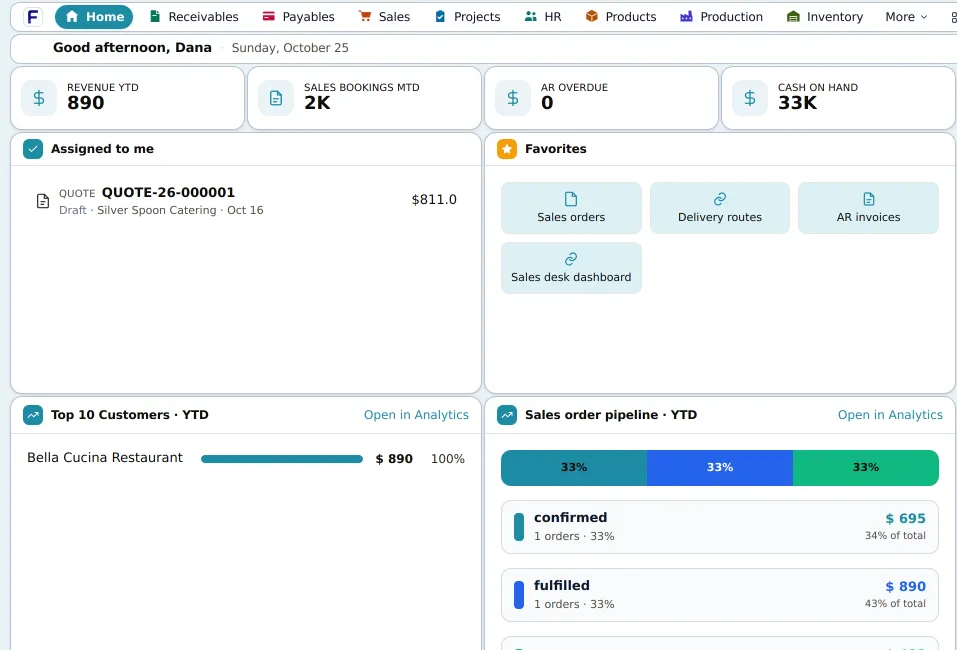
The day starts with the numbers that matter to the role.
Each person's home shows the KPI tiles, lists and work queues their role may see: revenue year to date, bookings this month, overdue receivables, cash on hand, what is assigned to them and the order pipeline.
In detail
What it covers
Everything this capability does, grouped. Open it for the specifics your IT team and power users will ask about.
Open the full listClose the list
In detail
What it covers
Everything this capability does, grouped. Open it for the specifics your IT team and power users will ask about.
Open the full listClose the listAnalytics module
- Thirteen views: summary, customers, growth, year-over-year, products, trend, sales orders, purchase orders, profit and loss, balance sheet, reports, AI insights and projects
- Filters by customer, product, vendor, status and branch; drill-down from any figure to the documents behind it
- Results cached and refreshed by the business event that changes them; closed periods frozen
- Every chart downloads as PNG or as CSV of the plotted series
- Cash-flow forecast over 4 to 26 weeks from bank cash, receivables due and payables due
Reports and dashboards
- Report builder over any of the registered record types, custom objects included: columns with custom fields, filters, grouping and totals, CSV export, private or shared
- Reports respect the record's read permission and run as parameterized, company-scoped queries
- Dashboards with KPI and table tiles bound to saved reports, drag to reorder, private or shared; a tile shows only what the viewer could get by running the report
- Financial statements on editable layouts with your company header and logo
Home per role
- A resizable home canvas with KPI tiles, charts, lists, favourites, My Work, quick-create, cash-flow forecast and more
- A default home per role; each KPI figure is hidden unless the role may read it
- Sales KPIs such as bookings, order count, average order value, open quotes, win rate and first-time buyers
- AI Insights: concise observations on revenue trend, margins, cash, receivables and payables risk, top customers and vendors, from live data
Good to know
Before you implement, and what this capability does not do today.
We state limits plainly so your evaluation is based on the product as it is; ask in the demo about anything on the roadmap.
Implementation and integration notes
- Analytics figures refresh when the business event that changes them happens; they are not streamed in real time.
- The report builder returns up to 1,000 rows per run; larger sets export from the list pages as CSV.
- Reports and dashboards respect each record's read permission, so a shared dashboard shows each viewer only what their role may see.
Current limits
- Reports run on demand; there are no scheduled or e-mailed report runs.
- The report builder returns up to 1,000 rows per run; export larger sets from the list pages.
- No budget-versus-actual reporting; the Analytics figures are refreshed by business events, not streamed in real time.
See Fritech ERP on your own order, receipt and month-end.
Tell us how your business works. We come back with a few times to choose from, and the demo runs in the product on your scenarios, not a slide deck.